CallPal
Search for the best time to cold call and you will get the same two windows repeated everywhere: late morning and late afternoon, with Wednesday and Thursday as the good days. The advice is not wrong exactly. It is just that almost all of it traces back to a small number of studies of a particular kind of buyer in a particular market at a particular time, and it is presented as though it were physics.
Your list is not that list. A restaurant owner is unreachable at noon and free at 3pm. A software buyer is in back-to-back meetings from 10 to 12. A tradesperson answers the phone from a van at 7am and never again. Averaging those together produces a number that describes nobody.
The good news is that this is one of the few questions in sales you can answer empirically in two weeks with data you are already generating.
Why the published windows still contain something true
Strip out the specific hours and three structural patterns survive across most B2B lists, because they follow from how the working day is shaped rather than from any industry:
- There is a dip in the middle of the day. People are eating, commuting to lunch, or away from a desk. It shows up in almost every dataset.
- The first hour of the day is unproductive to call into. Inboxes, standups, and the reflex of not answering an unknown number before coffee.
- The end of the day is quieter but higher-intent. Fewer people answer; the ones who do have more time.
What you cannot borrow from anyone else is where those boundaries sit for your buyers, and how large the differences are. That is worth measuring, because the gap between the best hour and the worst is frequently large enough to matter more than any change to your script.
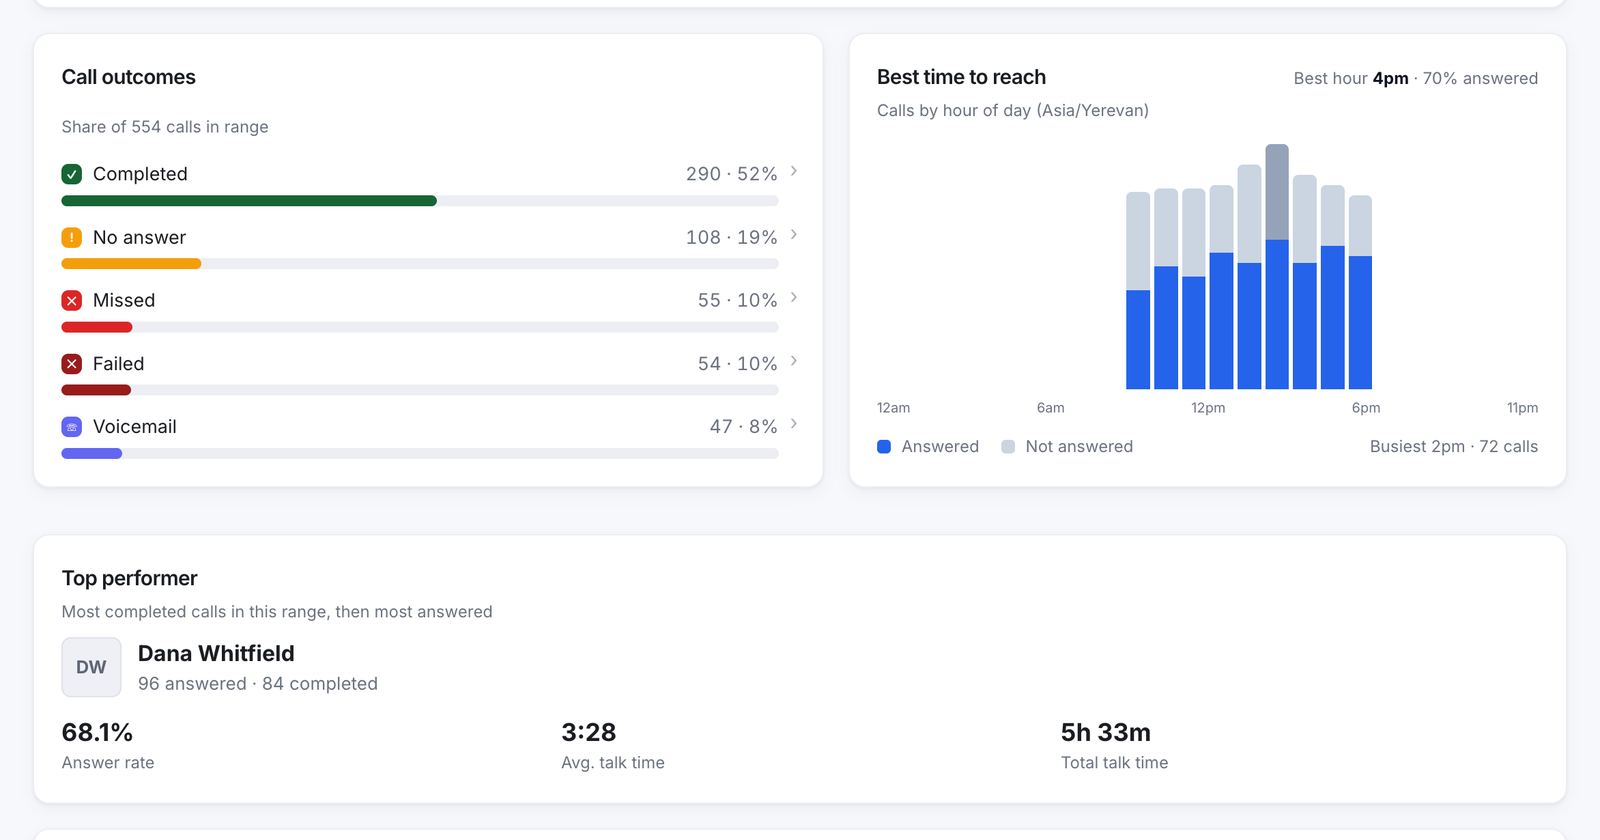
Read that chart in the right order. Bar height is where your reps are dialing — a decision they made. The filled proportion is how often people answered — a fact about your market. The two are easily confused, and confusing them is how a team concludes that its most-dialed hour is its best hour.
The two-week method
Week 1: spread the dials deliberately
Your existing data is biased, because your reps already believe something about when to call and have been dialing accordingly. An hour with 300 dials and one with 20 cannot be compared. So for one week, distribute dials roughly evenly across every hour you are willing to call in.
- Pick the window you would ever call inside — commonly 8am to 6pm in the contact’s time zone, and check the calling-hour rules that apply to you before you widen it.
- Split each rep’s daily dials into roughly equal blocks across those hours.
- Draw contacts for each block at random from the same list. Do not let reps choose which contacts go in which block, or the experiment measures their instincts rather than the hours.
- Keep the script fixed. One variable at a time.
Week 2: repeat it
One week is not enough. A public holiday, a conference in your sector, or one enthusiastic rep having a good Tuesday will all masquerade as an hourly effect. Run it twice and keep only the pattern that appears in both.
Then read it in the contact’s time zone
This is the mistake that invalidates most of these experiments. If your reps are in New York and a third of your list is on the west coast, an "8am" bucket in your dashboard contains two completely different experiences. Bucket by the local time where the phone is ringing, not where the rep is sitting — our calling hours checker shows what hour it currently is in any US state.
What to do with the answer
| What you find | What to do |
|---|---|
| One clear peak, 10+ points above the rest | Protect it. No meetings, no admin, everyone on the phones during that hour. |
| Two peaks with a midday trough | Book internal work into the trough and stop dialing through it entirely. |
| Flat within a few points all day | Time is not your lever. Go and work on list quality or the opening line instead. |
| Best hour is one you barely dial | You have found free pipeline. Reweight tomorrow. |
| Different peaks per segment | Split the list. Owner-operators and office workers should not be in the same calling block. |
Four things that matter more than the hour
Timing is a real lever and a small one. Before spending a quarter optimising it, check the four things that move answer rate further:
- Whether your number is being flagged. Carrier analytics label numbers that produce a wall of very short calls. A flagged number arrives on the handset as "Spam Likely" and no calling hour rescues it.
- Whether the number is local or recognisable. People answer numbers they can place. This is also the most heavily abused tactic in outbound, so use a real number your company answers, not a rotating pool.
- How fast you call an inbound lead. Speed to lead swamps time of day. Someone who filled in a form nine minutes ago will answer at almost any hour.
- How many times you try. Most first attempts fail. The median contact takes several attempts to reach, and teams that stop at two never see their own best hour clearly because they never accumulate enough attempts.
If you are already tracking answer rate by hour, the other eleven metrics worth watching are in 12 outbound sales KPIs that actually predict pipeline.